
- Department of Pathology, National Taiwan University Hospital, National Taiwan University College of Medicine, No.1, Jen-Ai Road, Taipei 100, Taiwan
- Internal Medicine, National Taiwan University Hospital, National Taiwan University College of Medicine, No.1, Jen-Ai Road, Taipei 100, Taiwan
- Graduate Institute of Biotechnology, College of Bioresources and Agriculture, National Taiwan University, 4F., No.81, Changsing St., Taipei 106, Taiwan
- Graduate Institute of Microbiology, National Taiwan University Hospital, National Taiwan University College of Medicine, No.1, Jen-Ai Road, Taipei 100, Taiwan
Molecular Cancer 2010, 9:32 doi:10.1186/1476-4598-9-32
Received: 19 September 2009
Accepted: 9 February 2010
Published: 9 February 2010
© 2010 Liu et al; licensee BioMed Central Ltd.
This is an Open Access article distributed under the terms of the Creative Commons Attribution License (http://creativecommons.org/licenses/by/2.0), which permits unrestricted use, distribution, and reproduction in any medium, provided the original work is properly cited.
About 30-50% of Hodgkin lymphomas (HLs) harbor the Epstein-Barr virus (EBV), but the impact of EBV infection on clinical outcomes has been unclear. EBV-encoded small RNAs (EBERs) are presented in all EBV-infected cells, but their functions are still less understood.
EBER1 was transfected into two HL cell lines, KMH2 and L428, and microarrays were used to screen for EBER1-induced changes. We found that EBER1 suppressed p21cip1/waf1 transcription in HL cell lines. In addition, positive regulators of p21cip1/waf1 transcription, such as p53, EGR1, and STAT1, were decreased. Suppression of p21cip1/waf1 in the EBER1+ HL cell lines was associated with increased resistance to histone deacetylase inhibitors or proteasome inhibitors, drugs known to cause apoptosis by increasing p21cip1/waf1 levels. On biopsy specimens, EBV+ HLs had weaker expression of both p21cip1/waf1 and active caspase 3. Clinically, suppression of p21cip1/waf1 in EBV+ HLs was associated with a worse 2-year disease-free survival rate (45% for EBV+ HLs vs. 77% for EBV- HLs, p = 0.002).
Although the underlying mechanisms are still relatively unclear, EBER1 inhibits p21cip1/waf1 transcription and prevents apoptosis through down-regulation of p53, EGR1, and STAT1. The anti-apoptotic activity of EBER1 may be important in the rescue of Reed-Sternberg cells from drug-induced apoptosis and in the clinical behaviors of EBV+ HLs.
In industrialized countries, about 30-50% of Hodgkin lymphomas (HLs) have been associated with the Epstein-Barr virus (EBV), but the impact of EBV infection on the clinical outcomes has been difficult to measure, because most HLs respond well to chemotherapy. In a multicenter retrospective survey, the prognosis was found to be worse for adult EBV+ HLs than for their EBV- counterparts(1). However, the underlying mechanism is still unknown.
In addition to HL, EBV is also associated with Burkitt's lymphoma, nasopharyngeal carcinoma, and other malignancies(2). Although EBV can switch its life cycle between a lytic phase and a latent phase(3), the virus exists only in a latent phase in EBV-infected tumor cells. The latent phase is characterized by the variable expression of a limited set of virus-encoded genes, including 6 nuclear antigens (EBNAs 1, 2, 3A, 3B, 3C, & LP), 3 latent membrane proteins (LMPs 1, 2A, 2B), and 2 small homologous RNAs (EBERs 1& 2). Depending on the expression patterns, the latent phase can be further classified into three types(4). EBNA1 and EBERs are the only EBV-encoded genes common to all latencies. They are probably indispensable for latency maintenance or malignant transformation.
In the latency phase, EBNA1 maintains replication of the episomal form of the virus(5), and it enhances the growth of HL cells(6). In contrast, the roles of EBERs are unclear and controversial. EBER probably interacts with both a ribosomal protein L22 and an RNA-dependent protein, PKR(7). According to one model, PKR may induce apoptosis; EBERs antagonize PKR-mediated apoptosis, whereas L22 competes with PKR for EBERs binding and abolishes the anti-apoptotic activity of EBERs. The anti-apoptotic activity of EBERs is consistent with the finding that EBV infection could reduce apoptosis in Burkitt's lymphoma(8)(9). In addition, PKR-independent anti-apoptotic activities of EBERs have been reported(10), but the mechanism and clinical significance are still unknown.
To address the mechanism and clinical significance of the anti-apoptotic activity of EBERs, we analyzed the EBER1-induced changes in HL cell lines using microarrays and found that EBER1 suppressed p21cip1/waf1 transcription. p21cip1/waf1 is also known as the cyclin-dependent kinase inhibitor 1A (CDKN1A), and it normally causes cell cycle arrest at the G1/S phase, and induces or inhibits apoptosis(11)(12)(13). We demonstrated that decreased p21cip1/waf1 transcription is associated with increased resistance to drug-induced apoptosis in HL cell lines. Most significantly from a clinical perspective, suppression of p21cip1/waf1 and the increased resistance to drug-induced apoptosis are associated with a worse prognosis in cases of EBV+ HLs.
Briefly, about 1 × 10⁶ KMH2 or L428 cells were transfected with 30 μg EBER1-expressing plasmid (p9362-EBER1), antisense-EBER1-expressing plasmid (p9362-antisense-EBER1), or control plasmid (p9362) by electroporation with an ECM630 system (BTX, Holliston, MA). Stable clones were selected in RPMI1640 and 10% fetal bovine serum containing 1 mg/mL GENETICIN (Invitrogen, Carlsbad, CA). EBER1+ cell lines (KE & LE), an antisense-EBER1+ cell line (K-Anti-E), and plasmid-only cell lines (K9 & L9) were established. A purity of greater than 99% of EGFP+ cells was confirmed by flow cytometric analysis and expression of EBER1 was confirmed by Northern blotting.
5'-ACAGACACCGTCCTCACCACCCGGGACTTGTACCCGGGACGGGTG-3' for EBER1
or 5'-TCTTCTCTGTATCGTTCCAATTTTAGTATATGTGCTGCCG-3' for U6.
Briefly, 2.5 μg small RNAs were separated on a 5% denaturing polyacryamide gel and transferred to a Hybond-N membrane (Amersham, Little Chalfont, Bucks, UK). The membrane was hybridized with the EBER1 or U6 probe at a concentration of 50 ng/mL in a buffer containing 50% formamide at 52°C for 16 hours. The membrane was then washed twice with 2 × SSC in 0.1% SDS at 25°C for 5 min, and twice with 0.2 × SSC in 0.1%SDS at 68°C for 10 min. Anti-digoxigenin-AP and CSPD (Roche, Mannheim, Germany) were used for development of chemiluminescence.
Local normalization of the extracted raw data was done online at http://pevsnerlab.kennedykrieger.org/snomadinput.html webcite(15). In this method, the significance of the difference between the EBER1+ cell lines and the control cell lines was designated by the z-score. For example, the p21cip1/waf1 transcripts had a 2-fold decrease from 2260 in K9 to 1164 in KE, a mean level of 1712, and a z-score, ZK, of - 2.5. The z-score meant that the 2-fold decrease for p21cip1/waf1 was located at -2.5 standard deviations, when normalized with respect to the changes of genes with a similar mean level of expression. Each gene thus had a ZK for KE vs. K9, and a second ZL for LE vs. L9. The changes for the gene were concordant if both z-scores were positive or both z-scores were negative.
The PCR products were separated by high-resolution capillary electrophoresis and quantified by fluorescence. The size of the PCR products in base pairs were: 216 for variant 1, 296 for variant 2, 179 for alt-a, 225 for alt-a', 191 for alt-b, 349 for alt-c, 208 for B, and 213 for C. The 3 variants (alt-a, a' and b) from the same PCR had different sizes due to alternative splicing.
Apoptosis induced by TSA & MG115 measured by flow cytometry for Annexin V and propidium iodide TSA (Trichostatin A, a histone deacetylase inhibitor from Sigma, Saint Louis, MO, USA) and MG115 (a proteasome inhibitor from Calbiochem, San Diego, CA) were used to induce apoptosis through up-regulation of p21cip1/waf1. About 1 × 10⁵ KE, K9, LE, or L9 cells were grown in 1 mL of medium containing by 0.5 μM TSA or by 0.4 μM MG115. After 2 days, the cells were harvested, washed twice with 1× PBS, and suspended in 100 μL 1× binding buffer containing 10 mM Hepes at pH 7.4, 140 mM NaCl, and 2.5 mM CaCl2. The cells in 100 μL binding buffer were mixed with 5 μL APC-conjugated Annexin V (BD Pharmingen, Franklin Lakes, NJ) and 5 μL of 50 μg/mL propidium iodide at 25°C for 15 min. The stained cells were diluted with 400 μL of 1× binding buffer and analyzed by flow cytometry within 1 hour.
Briefly, after cell lysis and protein extraction, 25 μg proteins were loaded onto p21cip/waf1 antibody-coated microwells at 37°C for 2 hours. A detection antibody for p21cip/waf1, an HRP-linked secondary antibody, and the TMB substrate were applied sequentially. The absorbance at 450 nm was measured, and the background absorbance was subtracted out. The ratios of the absorbances of treated cells to those of untreated cells were calculated.
In situ hybridization for EBER1 was done on formalin-fixed, paraffin-embedded tissue sections with a dig-labeled probe, 5'-ACAGACACCGTCCTCACCACCCGGGACTTGTACCCGGGACGGGTG-3'. The sections were detected with immunoalkaline phosphatase and developed with BCIP/NBT.
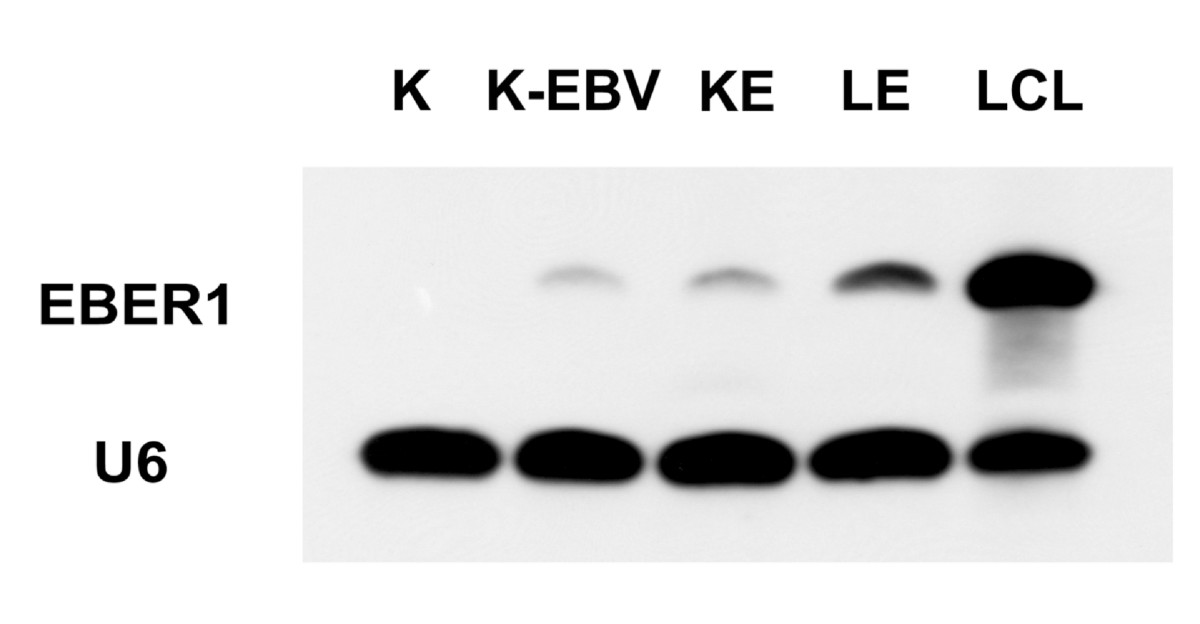
The expression of EBER1 was measured by Northern blotting in the KMH2 cell line (K), an EBV-infected KMH2 cell line (K-EBV), KE, LE, and an EBV-infected lymphoblastoid cell line (LCL). The expression of EBER1 in KE was similar to that of K-EBV. The expression of EBER1 in LE was higher than that of KE, but lower than that of LCL.
Click image to view larger.
Microarrays were used to screen for EBER1-induced changes, and the changes were measured by the z-score(15) A positive score was given if an increase was induced by EBER1, and a negative score was given if a decrease was induced by EBER1. A gene was therefore given a z-score, ZK, for the changes between KE & K9, and a second z-score, ZL, for the changes between LE & L9.
Because true physiologic actions of EBER1 should be induced in both KE and LE cell lines, ZK and ZL should be concordantly increased or decreased. For facilitating the identification of such concordant changes, the z-scores, ZK & ZL, were multiplied. The genes were then listed according to the values of ZK *ZL. The top 10 genes with the largest concordant decrease or increase are listed in Table 1. Among these top-ranking genes in Table 1, EGR1 and p21cip1/waf1 appeared to be functionally related, because EGR1 can activate p21cip1/waf1 transcription(18)(19).
| Unigene |
Gene Title |
K9 |
KE |
L9 |
LE |
ZK |
ZL |
ZK*ZL |
|---|---|---|---|---|---|---|---|---|
|
|
||||||||
| Top 10 down-regulated genes |
||||||||
|
|
||||||||
| Hs.326035 |
Early growth response 1 |
379 |
110 |
3992 |
437 |
-3.8 |
-6.1 |
23.2 |
| Hs.370771 |
Cyclin-dependent kinase inhibitor 1A (p21, Cip1) |
2260 |
1164 |
613 |
18 |
-2.5 |
-7.6 |
19.4 |
| Hs.440366 |
Similar to sirtuin 5 isoform 2; sir2-like 5 |
340 |
93 |
1416 |
201 |
-3.9 |
-4.7 |
18.5 |
| Hs.56382 |
Hexamthylene bis-acetamide inducible 2 |
208 |
54 |
316 |
24 |
-3.4 |
-5.3 |
18.1 |
| Hs.3210 |
Renin |
483 |
21 |
93 |
20 |
-7.8 |
-2.2 |
17.0 |
| Hs.143757 |
Similar to zinc finger protein 111 |
450 |
123 |
258 |
42 |
-4.1 |
-3.7 |
15.1 |
| Hs.199877 |
Copine IV |
454 |
154 |
2186 |
449 |
-3.6 |
-4.1 |
14.7 |
| Hs.501778 |
Tripartite motif-containing 22 |
1200 |
606 |
554 |
47 |
-2.7 |
-5.4 |
14.5 |
| Hs.349110 |
Hepatocyte growth factor-like |
184 |
50 |
317 |
50 |
-3.2 |
-3.8 |
12.4 |
| Hs.129867 |
Calcium and integrin binding family member 2 |
150 |
52 |
213 |
15 |
-2.6 |
-4.8 |
12.2 |
|
|
||||||||
| Top 10 up-regulated genes |
||||||||
|
|
||||||||
| Hs.292788 |
Homo sapiens, clone IMAGE:5189562, mRNA |
10 |
167 |
22 |
180 |
3.7 |
4.9 |
18.1 |
| Hs.147434 |
TRAF3 interacting protein 3 |
175 |
605 |
446 |
3676 |
2.8 |
6.4 |
17.9 |
| Hs.550344 |
CDNA FLJ32691 fis, clone TESTI2000221 |
25 |
185 |
66 |
250 |
3.9 |
3.9 |
15.4 |
| Hs.163914 |
Hypothetical protein DKFZp313G1735 |
14 |
138 |
15 |
160 |
3.2 |
4.6 |
14.8 |
| Hs.154510 |
Chr 2 open reading frame 4///Carbonyl reductase 3 |
15 |
97 |
11 |
244 |
2.3 |
6.2 |
14.2 |
| Hs.247831 |
Myosin light chain 2, precursor lymphocyte-specific |
77 |
384 |
82 |
308 |
3.5 |
4.0 |
14.0 |
| Hs.268939 |
Matrin 3 |
254 |
698 |
18 |
219 |
2.3 |
5.8 |
13.1 |
| Hs.515011 |
SMAD specific E3 ubiquitin protein ligase 2 |
67 |
232 |
114 |
580 |
2.7 |
4.8 |
13.0 |
| Hs.512709 |
Troponin I type 3 (cardiac) |
34 |
206 |
31 |
114 |
3.9 |
3.1 |
12.1 |
| Hs.530863 |
CASK interacting protein 1 |
19 |
126 |
35 |
162 |
2.9 |
4.0 |
11.8 |
From left to right, the columns show the UniGene number, the gene title, the gene symbol, the levels of the transcripts in K9, KE, L9, and LE, the z-score (ZK) for the comparison between K9 & KE, the z-score (ZL) between L9 & LE, and the product of ZK *ZL.
Liu et al. Molecular Cancer 2010 9:32 doi:10.1186/1476-4598-9-32
In Fig 2A, the transcripts of p21cip1/waf1-related genes were analyzed in details, such as EGR1, STAT1(20), p53(21)(22), and cyclins. Significantly, EGR1 and STAT1 were decreased by EBER1 across all probe sets that were used in the Affymetrix chip to monitor a single gene. In contrast, p53, a physiologic regulator of p21cip1/waf1, and cyclins, the physiologic targets of p21cip1/waf1, did not have consistent changes. These preliminary observations indicated that EBER1-induced p21cip1/waf1 suppression was related to EGR1 and STAT1, but not necessarily to p53, and did not lead to consistent changes in cyclins.
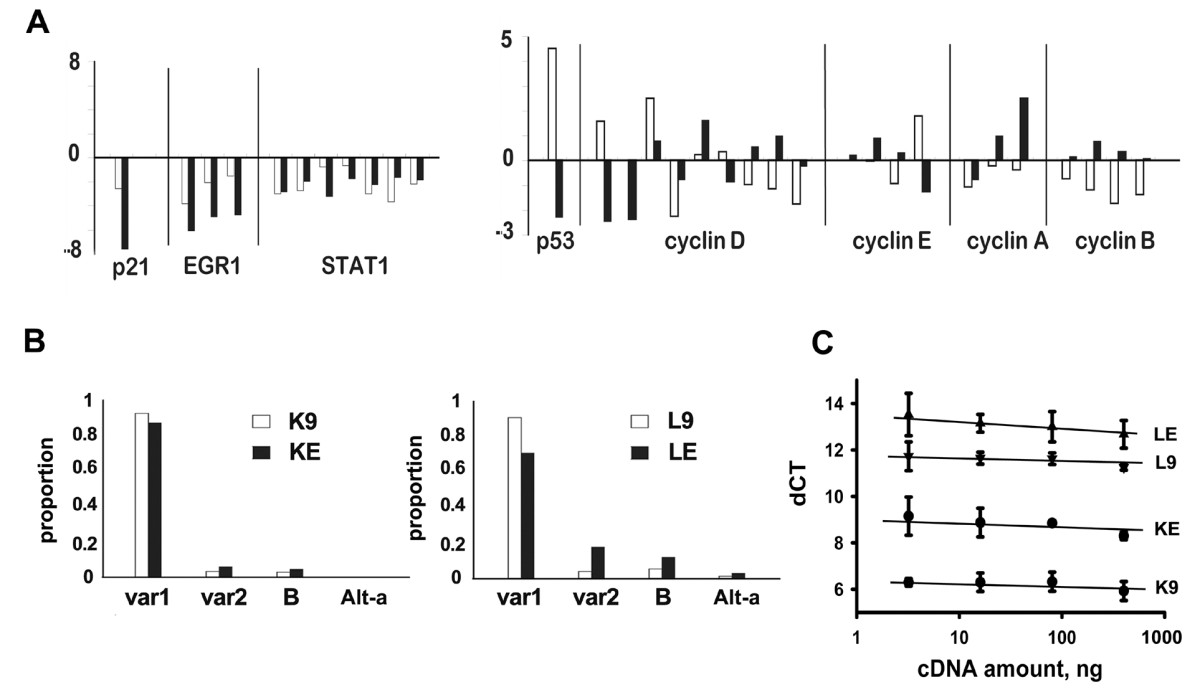
The z-scores, ZK in white and ZL in black, were plotted for the following genes: 1) p21cip1/waf1 & its regulators: EGR1 and STAT1, 2) cell cycle-related genes: p53 and cyclins. Note that the Affymetrix chip used multiple sets of probes to monitor a single gene, but only EGR1 and STAT1 showed consistent decreases across all probe sets. 2B: Eight splicing variants of p21cip1/waf1 have been reported: variant 1, variant 2, Alternative-a (Alt-a), Alternative-a' (Alt-a'), Alternative-b (Alt-b), Alternative-c (Alt-c), B, and C. EBER1 did not change the splicing patterns, as RT-PCR showed that variant 1 was always the dominant form for K9, KE, L9, and LE. X-axis: p21 variants; Y-axis: proportions of the variants. Only the major variants, variant 1, variant 2, B, and Alt-a were shown. The others variants were all less than 1%. 2C: Representative real-time RT-PCRs for p21cip1/waf1 were shown. X-axis: cDNA amount; Y-axis: dCT (the threshold cycle of p21cip1/waf1 minus that of actin). Triplicate measurements were taken at each one of 4 cDNA concentrations. The dCT (mean +/- SD) was 6.2 +/- 0.2 for K9, 8.7 +/- 0.4 for KE, 11.5 +/- 0.2 for L9, and 13.0 +/- 0.4 for LE.
Click image to view larger.

3A: EBER1 suppressed p21cip1/waf1. Left panel: EBER1 decreased p21cip1/waf1 in KE and LE, although overloading was necessary to show the much weaker levels of p21cip1/waf1 in L9 & LE. Right panel: EBER1 but not antisense EBER1 suppressed p21cip1/waf1. 3B: EBER1 suppressed EGR1, STAT1, and p53, but had no consistent effects on SirT5. The doublets of STAT1 were due to isoforms. 3C: Western blotting showed decreased cyclin D2 in KE & LE, but no changes in the levels of CDKs or other cyclins. 3D: Cell cycle distributions of K9 (dash) and KE (solid) on the left, L9 (dash) and LE (solid) on the right. There were no detectable differences in the cell cycle distributions between KE & K9, or LE & L9. The Y-axis is the number of cells. The X-axis is the intensity of propidium iodide (PI) on a linear scale from zero to 1000. The first peak at around 250 had diploid DNA content (2N) and was the peak of the G0/G1 phase. The second peak at around 500 had quadruploid DNA content (4N) and was the peak of the G2/M phase. Between these 2 peaks, cells were in S phase.
Click image to view larger.
In Fig 3B, the positive regulators of p21cip1/waf1 transcription, such as EGR1 & STAT1, were decreased by EBER1. Unexpected from the array data, p53, another positive regulator of p21cip1/waf1 transcription, was also decreased in both KE & LE cell lines.
Because p21cip1/waf1 transcription was reported to be up-regulated by histone acetylation(23)(24), Western blotting for the histone deacetylase, SirT5, was performed. SirT5 was decreased in the KE cell line, but increased in the LE cell line. Further experiments are thus necessary for clarifying the role of SirT5.
The susceptibility of K9, KE, L9, and LE to drug-induced apoptosis was tested. Triplicate measurements by flow cytometry showed that the percentages of viable cells (mean +/- SD) after TSA treatment (Fig 4A) were 91.1 +/- 2.0 for K9, 93.0 +/- 4.9 for KE, 25.2 +/- 13.6 for L9, and 76.9 +/- 5.3 for LE. L9 and LE had less viable cells than K9 and KE. Significantly, L9 was even less viable than LE (p = 0.04, paired t-test). Similarly, the percentages of viable cells (mean +/- SD) after MG115 treatment (Fig 4B) were 55.1 +/- 11.7 for K9, 76.9 +/- 7.3 for KE, 95.9 +/- 6.2 for L9, and 95.3 +/- 2.6 for LE. K9 and KE had less viable cells than L9 and LE. Significantly, K9 was even less viable than KE (p = 0.03, paired t-test). Thus, L9 was more sensitive to TSA than LE (Fig 4A), and K9 was more sensitive to MG115 than KE (Fig 4B). The differential sensitivities implied that intrinsic properties of the cell lines could have caused L9/LE to be more sensitive to TSA than K9/KE, and K9/KE to be more sensitive to MG115 than L9/LE.

4A & 4B: Left panel: Apoptosis induced by 0.5 μM TSA (4A) or 0.4 μM MG115 (4B) for 2 days was measured by flow cytometry. The X-axis is Annexin-V (AV) and the Y-axis is propidium iodide (PI). Both the X and Y-axes are in log scale from 100 to 104. Green: AV-/PI- viable cells. Blue: AV+/PIdim apoptotic cells. Red: AV+/PIbright dead cells. Right panel: The percentages of viable cells after treatments were measured. (Y-axis: percentage of viable cells; X-axis: cell lines). Note that L9 was the most sensitive cell line after TSA treatment (4A), and K9 was the most sensitive cell line after MG115 treatment (4B). 4C & 4D: Induction of p21cip1/waf1 by 0.5 μM TSA (4C) or by 0.4 μM MG115 (4D) was measured with ELISA. (Y-axis: p21cip1/waf1 of treated cell lines divided by that of untreated cell lines; X-axis: cell lines). Note that L9 showed the highest induction after TSA treatment and K9 showed the highest induction after MG115 treatment. 4E & 4F: After treatment with 0.5 μM TSA, L9 cells grew slower than LE cells(4E), and after treatment with 0.4 μM MG115, K9 cells grew slower than KE cells (4F). (Y-axis: cell numbers in 104; X-axis: duration of culture in days; UNT: untreated).
Click image to view larger.
ELISA was used to measure the induction of p21cip1/waf1 after drug treatments. The increase (mean +/- SD, triplicate measurements) after TSA treatment (Fig 4C) was 3.0 +/- 0.7 fold in K9 cells, 2.6 +/- 1.0 fold in KE cells, 9.5 +/- 1.9 fold in L9 cells, and 4.0 +/- 1.6 fold in LE cells. L9 and LE had more induction of p21cip1/waf1 than K9 and KE, and significantly L9 showed higher induction of p21cip1/waf1 than LE (p = 0.02, paired t-test). Similarly, the increase (mean +/- SD, triplicate measurements) after MG115 treatment (Fig 4D) was 3.7 +/- 0.4 fold in K9 cells, 2.1 +/- 0.5 fold in KE cells, 1.0 +/- 0.1 fold in L9 cells, and 0.8 +/- 0.1 fold in LE cells. K9 and KE had more induction of p21cip1/waf1 than L9 and LE, and significantly K9 showed higher induction of p21cip1/waf1than KE (p = 0.01, paired t-test). Thus, consistent with the data on apoptosis, L9 cells had the most significant increase of p21cip1/waf1 under TSA treatment (Fig 4C) and K9 cells had the most significant increase of p21cip1/waf1 under MG115 treatment (Fig 4D).
The effects of TSA and MG115 on cell growth were measured. Based on 4 repeats, the cell numbers at 48 hours (mean +/- SD in 104) after TSA treatment (Fig 4E) were 3.6 +/- 0.4 for untreated LE, 3.7 +/- 0.5 for untreated L9, 2.4 +/- 0.1 for treated LE, and 0.7 +/- 0.1 for treated L9. Treated L9 cells grew slower than the others (p < 0.001, one-way ANOVA). Similarly, the cell numbers at 48 hours (mean +/- SD in 104) after MG115 treatment (Fig 4F) were 3.3 +/- 0.1 for untreated KE, 2.8 +/- 0.1 for untreated K9, 1.8 +/- 0.1 for treated KE, and 0.6 +/- 0.1 for treated K9. Treated K9 cells grew slower than the others (p < 0.001, one-way ANOVA). Thus, L9 grew slower than LE cells when treated with TSA (Fig 4E), whereas K9 grew slower than KE cells when treated with MG115 (Fig 4F).
Taken together, these data were consistent with the hypothesis that EBER1 suppressed p21cip1/waf1 transcription and conferred resistance to drug-induced apoptosis in these model systems.
Ninety-four HLs, including 68 EBV- and 26 EBV+ cases, were used for the assessment of the clinical significance of p21cip1/waf1 suppression (Fig 5 and Table 2). Immunohistochemical stains were performed for p21cip1/waf1 (Fig 5A), active caspase 3 as an apoptotic marker(28), and Ki67 as a proliferation marker. The percentages of Reed-Sternberg cells that were positive for p21cip1/waf1 were determined, and the median values for the EBV+ and the EBV- groups were listed in Table 2. Compared with the EBV- group, the EBV+ group was slightly more likely to present at a later stage and a higher LDH level (p = 0.09 and 0.08, respectively). The EBV+ group expressed significantly less p21cip1/waf1 (44% vs. 76%, p < 0.001) and active caspase 3 (4% vs. 22%, p < 0.001), but had a similar amount of Ki67 (52% vs. 54%, p = 0.80).
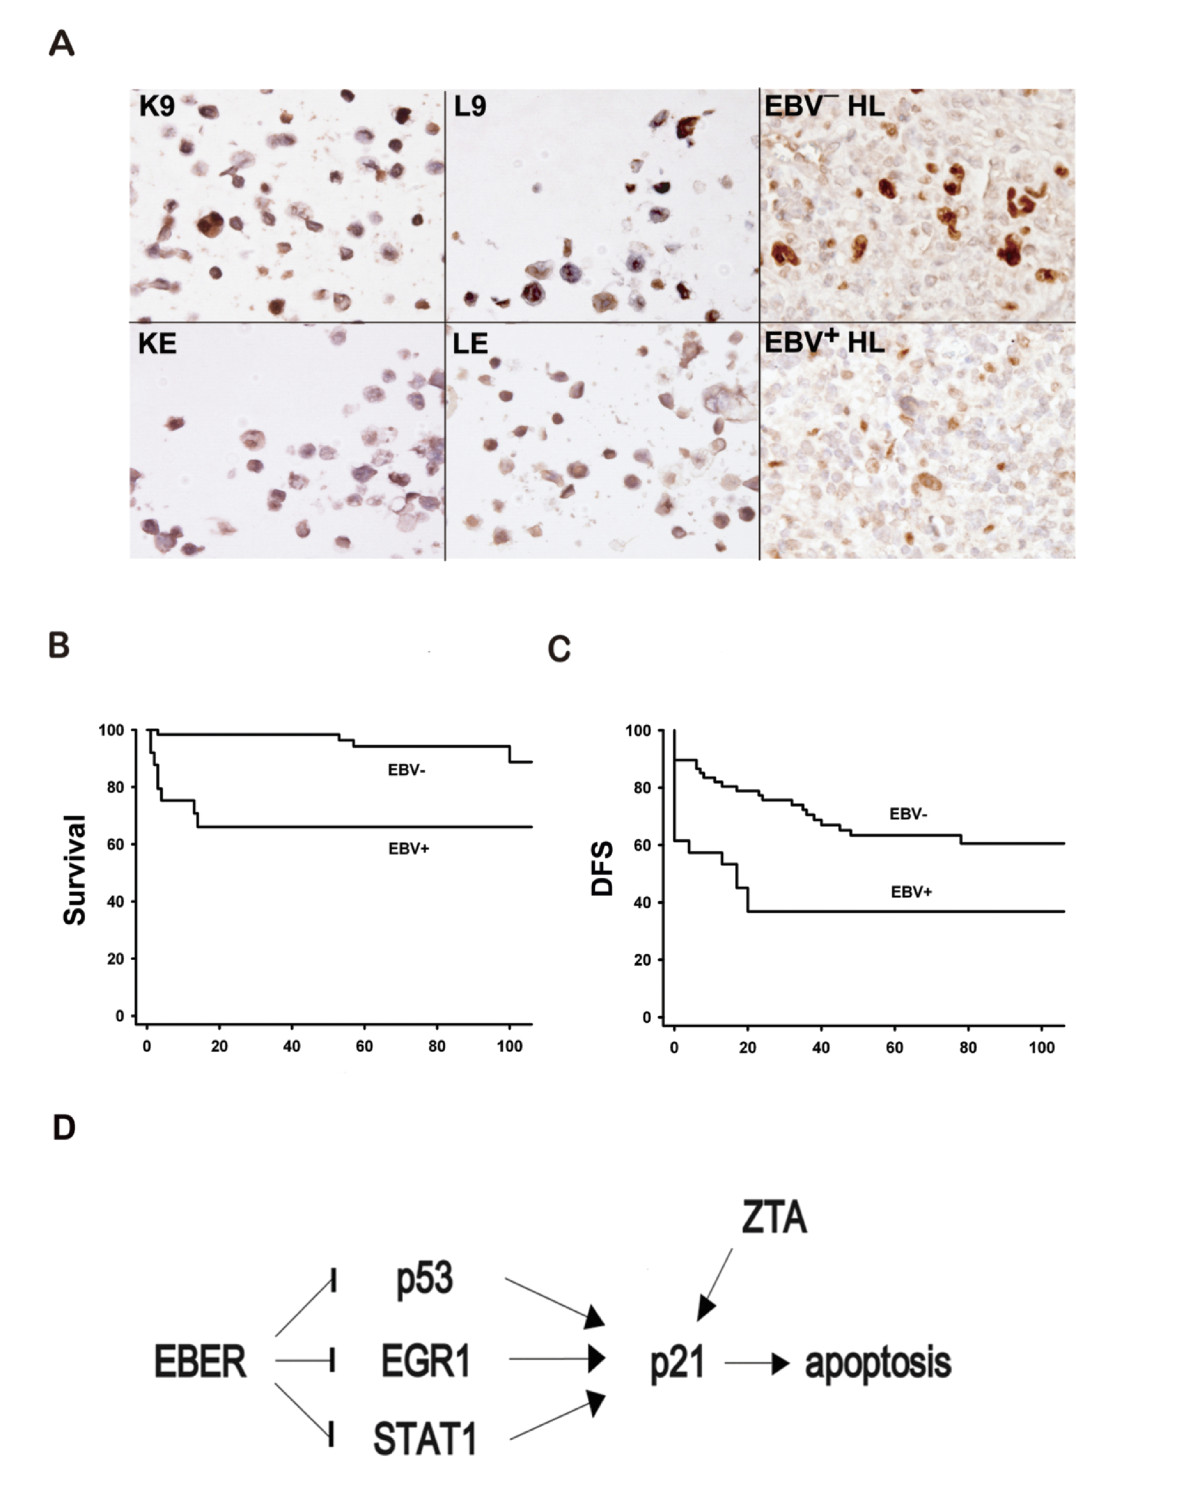
5A: Immunohistochemistry of p21cip1/waf1. Upper panel from left to right: K9, L9, and an EBV— HL were positive for p21cip1/waf1. Lower panel from left to right: KE, LE, and an EBV+ HL were negative for p21cip1/waf1. Immunoperoxidase stains on formalin-fixed, paraffin-embedded cell blocks or tissue sections. 5B: The EBV+ group also had a worse 2-year OS rate than did the EBV— group (68% vs. 98%, p < 0.001 by logrank test). 5C: The EBV+ group had a worse 2-year DFS rate than did the EBV— group (45% vs. 77%, p = 0.002 by logrank test). 5D: EBER1 inhibits apoptosis and maintains latency through p21cip1/waf1 suppression (Arrow: increase; Bar: decrease). Our data are consistent with the model that EBER1 could inhibit p21cip1/waf1 transcription through EGR1, STAT1, or p53. The inhibition of p21cip1/waf1 is associated with resistance to drug-induced apoptosis. Because p21cip1/waf1 is necessary for lytic induction by EBV-encoded ZTA (36)(37), EBER1 may be critical for the maintenance of the latency phase as well. Since the binding sites on the p21cip1/waf1 promoter for EGR1(18)(19), STAT1(20), and p53(21)(22) are already known, further studies are necessary to reveal how EBER1 suppresses p53, EGR1, and STAT1, and whether or not post-transcriptional regulations of p21cip1/waf1 are also involved.
Click image to view larger.
| EBV- |
EBV+ |
p |
|
|---|---|---|---|
| Clinical Manifestation | |||
| n |
68 |
26 |
|
| age |
34 |
44 |
0.18 |
| sex |
33:35 |
19:7 |
0.04 |
| stage, I&II |
72% |
50% |
0.09 |
| LDH |
459 |
544 |
0.08 |
| ABVD |
70% |
58% |
0.32 |
| Primary refractory |
9% (6/68) |
38% (10/26) |
0.002 |
| 2-year OS |
98% |
68% |
<0.001 |
| 2-year DFS |
77% |
45% |
0.002 |
| Biological markers |
|||
| p21cip1/waf1 |
76% |
44% |
<0.001 |
| active caspase 3 |
22% |
4% |
<0.001 |
| Ki67 |
54% |
52% |
0.80 |
From top to bottom, the rows which show clinical manifestation are: number of cases, median age in years, sex ratio in male: female, percentage of cases in stages I & II, median LDH (lactate dehydrogenase, normal at 230-460 U/L), percentage of cases initially treated with ABVD (Adriamycin, Bleomycin, Vinblastine, & Dacarbazine), percentage of primary refractory cases, estimated 2-year overall survival rate, and 2-year disease-free survival rate. The rows which show biological markers are: median percentage of Reed-Sternberg cells that were positive for p21cip1/waf1, active caspase 3, and Ki67.
Liu et al. Molecular Cancer 2010 9:32 doi:10.1186/1476-4598-9-32
The 2-year OS rate (98% vs. 68%, p < 0.001, Fig 5B) and 2-year DFS rate (77% vs. 45%, p = 0.002, Fig 5C) were both better in the EBV- group than in the EBV+ group. In our series, there were 6 primary refractory cases in the EBV- group and 10 primary refractory cases in the EBV+ group (9% vs. 38%, p = 0.002). The much higher frequency of primary refractory cases in the EBV+ group was the main reason for the worse prognosis.
Although EBV+ and EBV- HLs differed in several parameters and the clinical observations did not establish a casual link, these findings were consistent with the hypothesis that suppression of p21cip1/waf1 allowed the tumor cells in EBV+ HLs to escape spontaneous apoptosis or to resist drug-induced apoptosis, resulting in a more aggressive clinical behavior.
We found that EBER1 suppresses p21cip1/waf1 transcription and inhibits drug-induced apoptosis, but does not change the cyclins(31) except for cyclin D2. The anti-apoptotic activity of EBER1 could be critical in the rescue of HL cells from apoptosis. These cells have crippled immunoglobulin genes and should have undergone apoptosis in the germinal center(32). The increased resistance to drug-induced apoptosis offers a possible explanation for the worse clinical behavior of EBV+ HLs(1).
Although most HLs respond to chemotherapy, about 25% of HLs are refractory or relapse after an initial response(1). For these cases, it is important to identify prognostic factors, such as the sites and extent of relapse, and to adjust treatment accordingly. Apart from these obvious clinical predictors, biological predictors, such as suppression of p21cip1/waf1, should be useful. In fact, the clinical usefulness of p21cip1/waf1 as a prognostic factor has been reported repeatedly for other tumors (33), and our data suggested possible use of p21cip1/waf1 as a prognostic factor in EBV+ HL.
In our study, we have used TSA, a histone deacetylase inhibitor, and MG115, a proteasome inhibitor, to test the effect of EBER1 on drug-induced apoptosis in HL cell lines, because similar drugs are currently being evaluated for clinical usages. Bortezomib is a proteasome inhibitor found to cause cell cycle arrest and to induce apoptosis in HL cell lines. However, in a pilot study, the drug demonstrated minimal activity in relapsed and refractory HLs(26). Similar to the conclusion of this pilot study, our data imply that treatment with proteasome inhibitors in EBV+ refractory/relapsed HLs is likely to be ineffective. Vorinostat is a histone deacetylase inhibitor, which was found to suppress p21cip1/waf1, cause cell cycle arrest, and induce apoptosis in HL cell lines(27). Because we have compared only EBER1+ and EBER1- HL cell lines, whereas the Reed-Sternberg cells in EBV+ HLs also express EBNA1 and LMPs, it would be interesting to see whether these drugs are effective in EBV+ HLs in future clinical trials.
From the perspective of tumor biology, there are 3 subtypes of latency in EBV-infected tumor cells. EBV+ HL is typical of type II latency, and only a limited set of virus-associated genes is expressed. These genes include EBNA1, LMP1 & LMP2, and EBERs. EBNA1 keeps the viral genome in an episomal form, LMP1 transmits CD40-like signals to compensate for the lack of B-cell receptors(34), and LMP2A is a B-cell receptor mimic that is essential for survival(35). Because EBER1 may suppress p21cip1/waf1 transcription, and p21cip1/waf1 is necessary for lytic induction by EBV-encoded ZTA(36)(37), EBER1 may be critical for the maintenance of the latency phase.
To integrate the data on apoptosis, drug-resistance, and maintenance of the latency phase, we have presented a model of EBER1-induced p21cip1/waf1 suppression through EGR1, and STAT1 (Fig 5D). Other genes in Table 1 might be related to this model too. Sir-2-like 5 (SirT5) is a histone deacetylase that could suppress p21cip1/waf1 transcription(23)(24). HEXIM2, a double-stranded RNA-binding protein(38), and MATR3, which processes double-stranded RNAs(39), could have interacted with EBER1. Finally, TRIM22 is important for antiviral defense(40).
In addition to HL, Burkitt's lymphoma and post-transplantational lymphoproliferative disorder are also EBV-associated B-cell lymphomas that share a similar pathogenetic mechanism, in which EBV infection is important in the immortalization and transformation of B cells. In experimental conditions, EBV infection of primary B cells leads to p21cip/waf1suppression and overrides genotoxin-induced G1 arrest(41). These EBV-infected primary B cells are in type III latency and the suppression of p21cip/waf1 is due to post-transcriptional regulation, whereas HL is in type II latency and the suppression of p21cip/waf1 is regulated at the transcriptional level. Despite of the differences, the suppression of p21cip/waf1 appears to be a common event critical for the development of these lymphomas.
At greater than 5*106 copies per cell, EBERs are the most abundant RNAs in EBV-infected cells. Although EBERs seem to prevent apoptosis through interacting with PKR, the nuclear localization of EBERs and cytoplasmic localization of PKR make a direct interaction unlikely(10). Recently, EBERs were found to increase transcription or mRNA stability of IL-10, IL-9, or IGF1 in lymphoma or carcinoma cell lines(42). With recognition of transcriptional regulation by EBERs and other noncoding RNAs as important biological processes(44), suppression of p21cip/waf1 transcription deserves further investigations, because of the direct link with apoptosis and the known example of artificial microRNAs in regulating p21cip/waf1 transcription(45).
Diepstra et al(46) reported a series of 412 HL patients with a median age of 35 years. In patients older than 50 years, the five-year failure free survival was 60% in EBV+ cases vs. 85% in EBV- cases (p = 0.01). Our series of 94 cases had a median age of 31 years. In patients older than 45 years, the 5-year disease free survival was 37% in EBV+ cases vs. 74% in EBV- cases (p = 0.02). In patients younger than 45 years, the 5-year disease free survival was 50% in EBV+ cases vs. 67% in EBV- cases (p = 0.17). Our data and those reported by Diepstra et al were consistent in showing that EBV+ HL had a worse prognosis in the older age group.
In conclusion, EBER1 suppresses p21cip1/waf1 transcription and confers resistance to drug-induced apoptosis in HL cell lines. Biologically, this anti-apoptotic activity might be important in the rescue of Reed-Sternberg cells and in the maintenance of the latent phase. Clinically, the suppression of p21cip1/waf1 in EBV+ HL predicts a worse prognosis, and the possibility of increased resistance to drug-induced apoptosis might have therapeutic implications.
The anti-apoptotic activity of EBER1 is well known. In this study, we showed that EBER1 suppressed p21cip1/waf1 in HL cell lines through down-regulation of p53, EGR1, and STAT1, and EBER1+ HL cell lines were more resistant to apoptosis induced by histone deacetylase inhibitors or proteasome inhibitors. Because these drugs were known to act by increasing p21cip1/waf1, the anti-apoptotic activity of EBER1 was probably through the suppression of p21cip1/waf1. Clinically, EBV+ HLs had weaker expression of p21cip1/waf1 and a worse prognosis, which also supported a critical role of EBER1 in the rescue of Reed-Sternberg cells from apoptosis and in the clinical behaviors of HLs.
The authors declare that they have no competing interests.
TYL performed the most of experiments and wrote the manuscript. SJW analyzed the clinical data. MSH and FYL constructed the plasmids and the cell lines. MHT performed the bioinformatics on the microarray data. CHT established EBV-infected KMH2 and lymphoblastoid cell lines. SMH participated in drafting the manuscript. CWL coordinated the whole project and revised the manuscript. All authors read and approved the final manuscript.
The array and the bioinformatics core laboratories at the Center for Genomic Medicine, National Taiwan University, performed the micro-array experiment and helped with data analysis. The project was supported by grants NSC 94-2320-B-002-055, NSC 95-2320-B-002-019, and NSC 96-2320-B-002-065 to CWL.